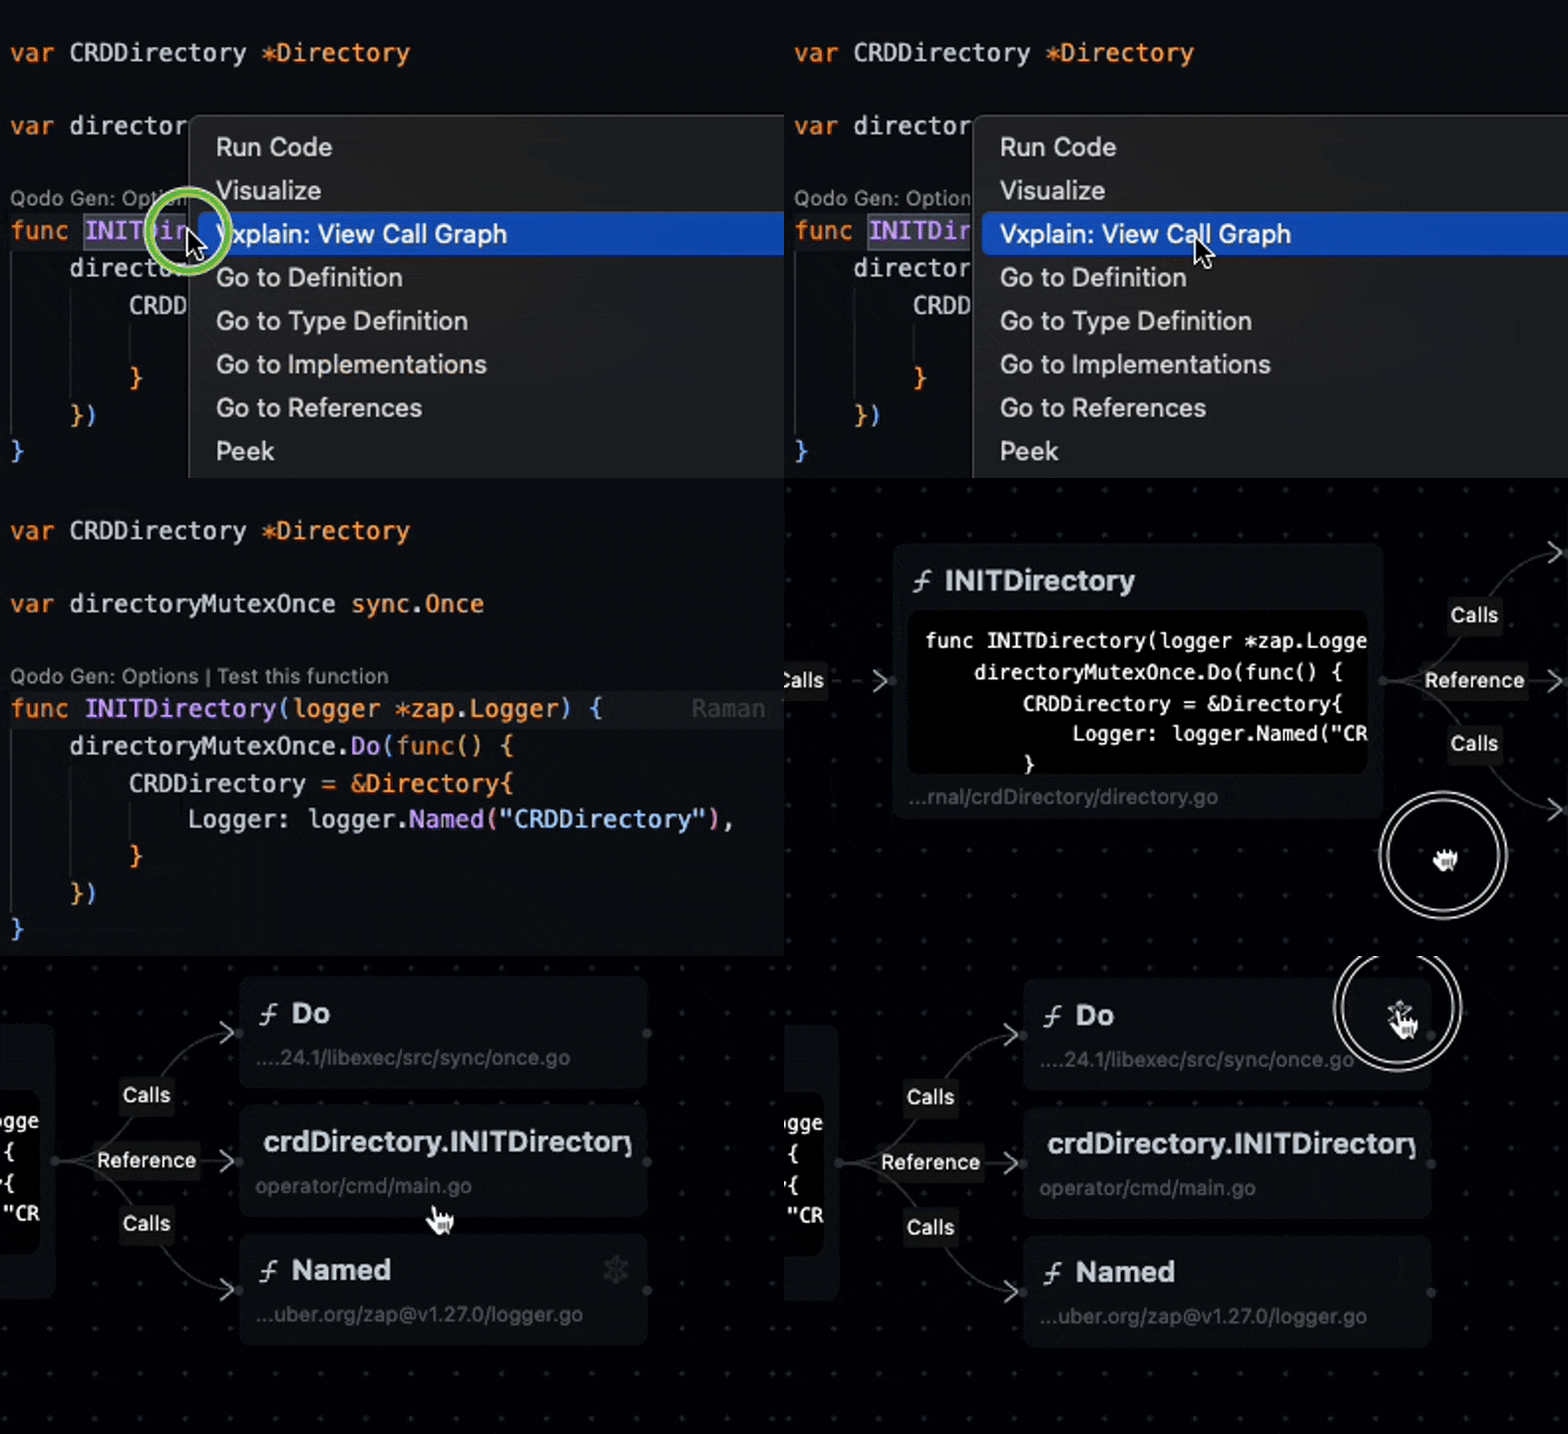
Vxplain: View Call Graph.

- Nodes: Each node in the call graph represents a function.
- Edges: The edges show the calls between functions. An arrow from function A to function B means that function A calls function B.
Interacting with Diagrams
The diagrams generated by Vxplain are interactive. You can:- Zoom and Pan: Use your mouse or trackpad to zoom in and out and pan around the diagram.
- Click on Nodes: Click on a node to see more information about the corresponding component, such as its source code.

